Analytics
The analytics page is where you will first land once successfully logged in to DeepHunter. This is the main dashboard that shows the list of threat hunting analytics available in DeepHunter. There are many actions you can do from this screen and you can also navigate to other modules.
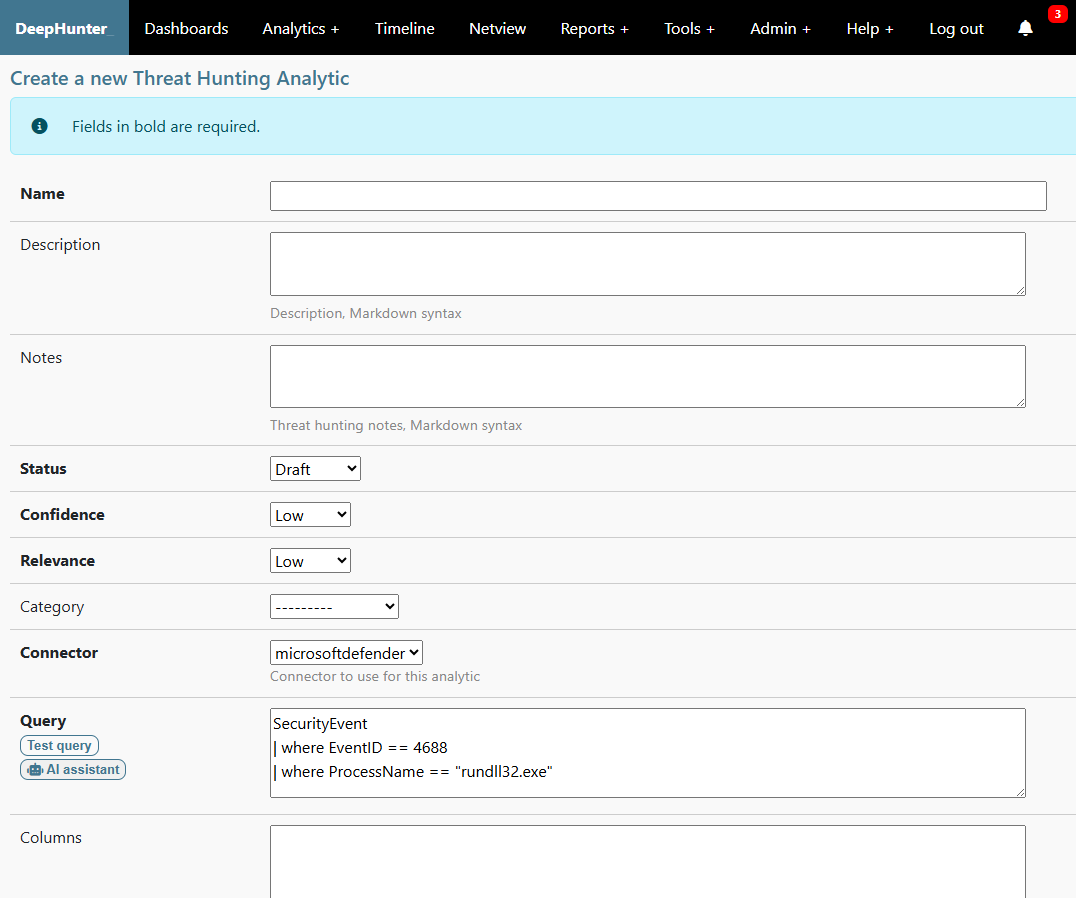
Create threat hunting analytics
To create new threat hunting analytic, go to the Aalytics > Create analytic menu.
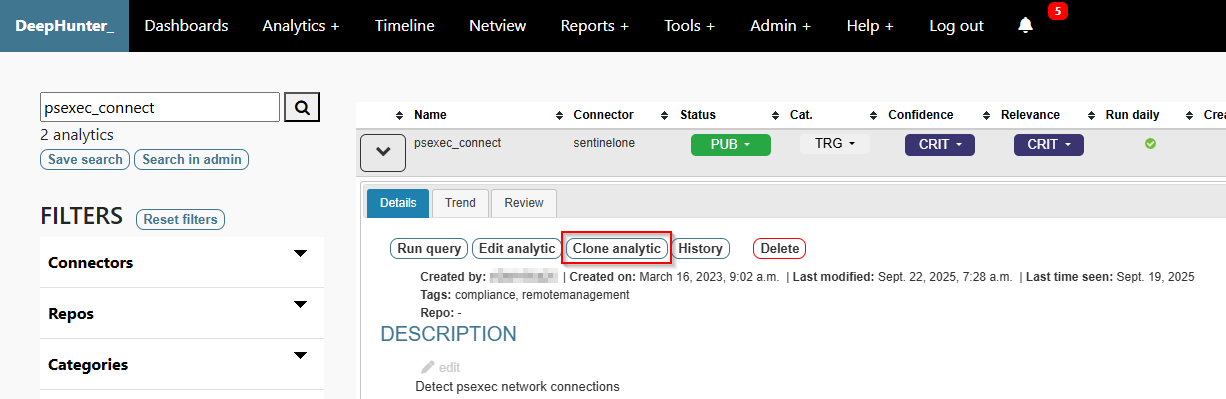
You can also create a threat hunting analytic by cloning an existing one. To do this, go to the Analytics page, expand the threat hunting analytic you want to clone, and click on the Clone analytic button. This will open the threat hunting analytic form pre-filled, without a name. You can then modify it as needed and save it.
Interface
Refer to the objects number for details.
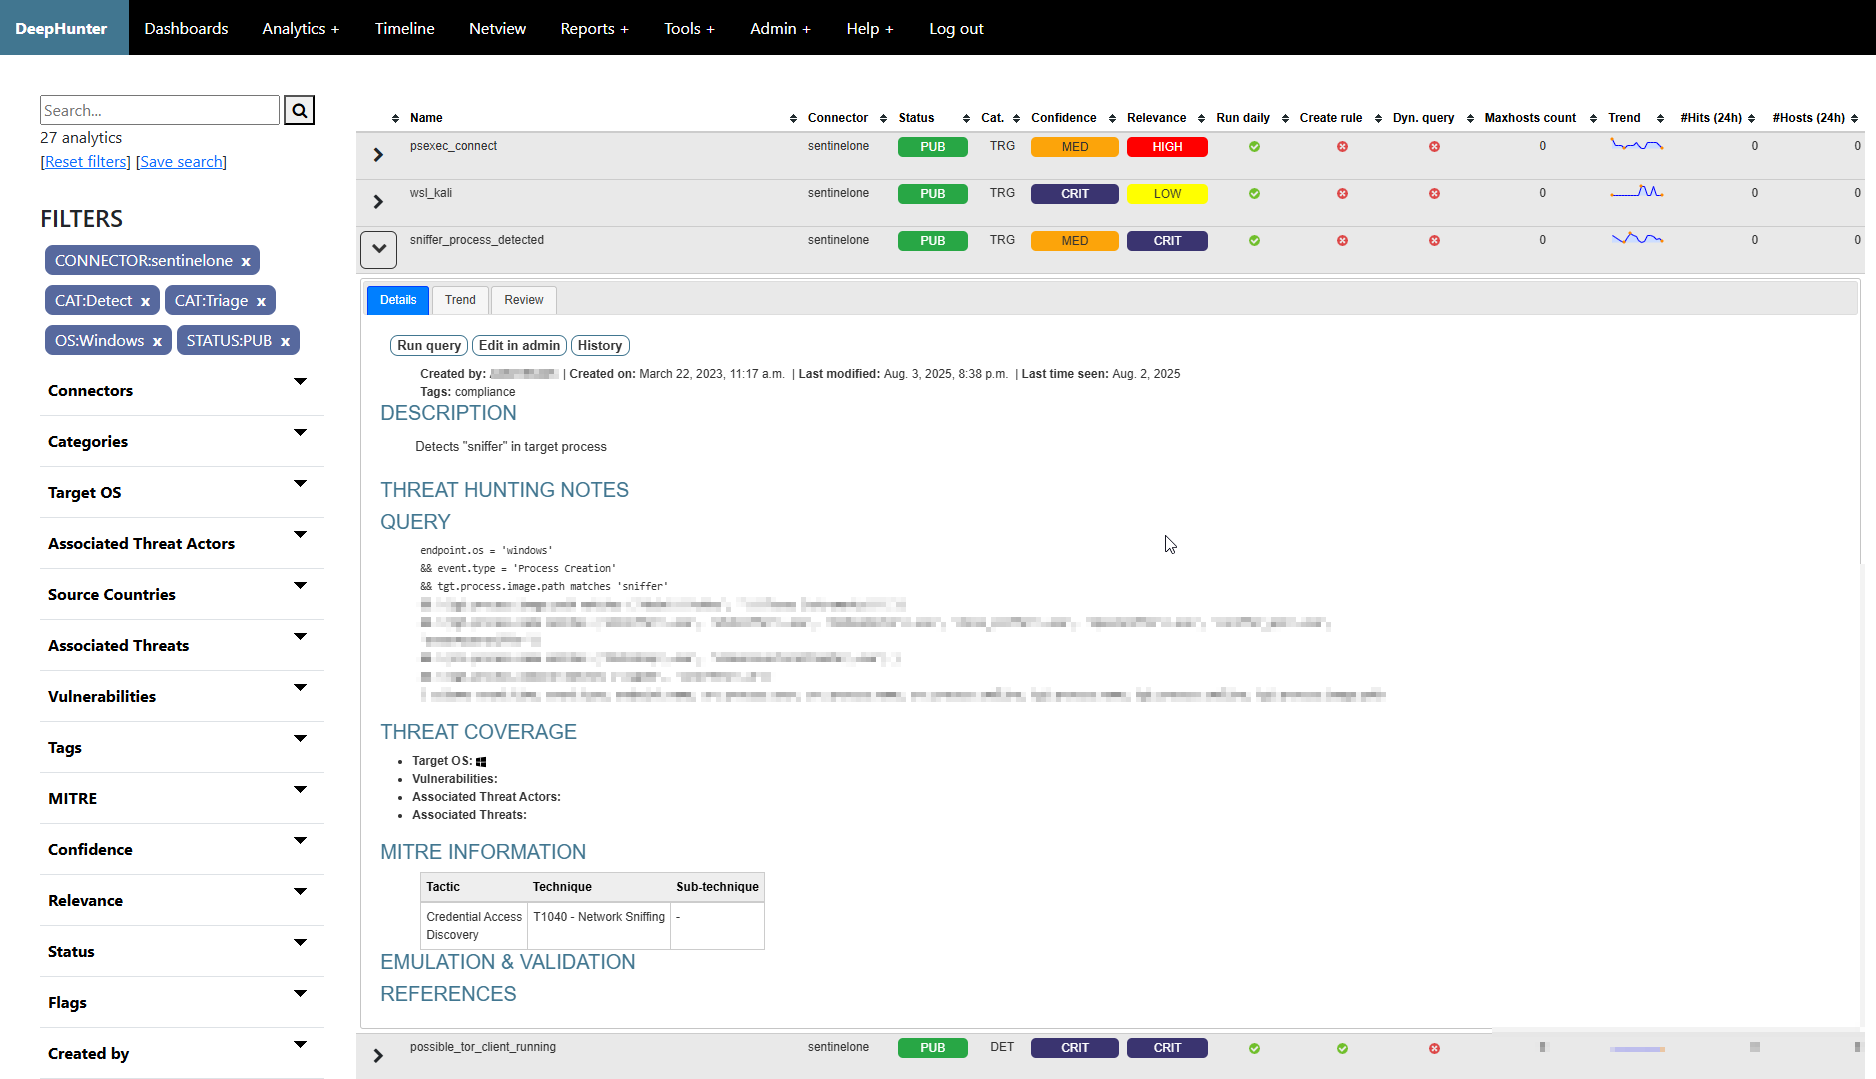
List of threat hunting analytics
This shows the list of threat hunting analytics available in the DeepHunter database. For each, you will have information shown in columns (clicking on the column header sorts the list):
Name: name of the analytic
Status: Status of the analytic in the worklfow. Clicking on a status will show a dropdown list with possible statuses that you can choose to update the analytic. This is automatically refreshed every 10 seconds.
Confidence: the confidence indicator (CRIT, HIGH, MED, LOW) tells how much you can trust the analytic. If it tends to output many “false positives”, the confidence will likely be “LOW”. On the other hand, a confidence of “CRIT” means that all matching events are real alerts.
Relevance: The relevance (CRIT, HIGH, MED, LOW) tells how bad it is for your organization if events match the threat hunting analytic, independantly from the confidence. Understand it as the “impact”. It may happen that you have an analytic that matches many events, only some of which are interesting/relevant. However, you may still want to keep this rule as matches may indicate a sign of compromise. In this case, the rule may have a low confidence, with a critical relevance.
Run daily: Flag indicating if the analytic is run daily (via the campaigns cron job). Remember that DeepHunter is a repository storing all threat hunting analytics, but not all of them may need to be automated. This flag is automatically refreshed every 10 seconds.
STAR rule: Flag indicating if the analytic has a matching STAR rule in SentinelOne. When you modify an analytic in DeepHunter, it will update the STAR rule in S1. Deleting a threat hunting analytic associated to a STAR rule will automatically delete the STAR rule in S1. Notice that the STAR rules will have the same name as the threat hunting analytic in DeepHunter. For that reason, a best practice is to name all of your analytics using characters in
a-z,0-9and replace spaces with_.Maxhosts count: Counts how many times
CAMPAIGN_MAX_HOSTS_THRESHOLDis reached. This counter is used (checkON_MAXHOSTS_REACHED) to automatically remove threat hunting analytics from future campaigns and/or delete associated statistics.Dyn query: Flag that indicates if the analytic is static or dynamic.
Trend: sparkline showing the trend (based on statistics collected by the campaigns) for the last 20 days.
Hits (24h): Number of matching events for the last 24h, according to the last campaign.
Hosts (24h): Number of matching unique endpoints for the last 24h, according to the last campaign.
Threat hunting analytic details
Details of each analytic can be viewed by clicking on the arrow on the left of each analytic name.
Header Information
top 10 endpoints + see all endpoints: Shows the list of top 10 endpoints identified by the last campaign. Clicking on an endpoint will open a new window, loaded with the timeline of the selected endpoint. If there are more than 10 endpoints, the
see all endpointslink redirects to the backend to show the full list of endpoints.Created on, last modified on, history: Date of creation and last modification. The
historylink shows all modifications, user and date for the analytic. It relies on thedjango-simple-historypackage.Tags: list of selected tags for the threat hunting analytic.
Sections
Description: This is the description of the threat hunting analytic. It uses the markdown syntax to format the text, and possibly add subsections (e.g., description, offensive tradecraft, examples, etc.)
Threat Hunting Notes: Notes to help threat hunters to triage events. For example, it can be used to inform about known false positives, or describe some exclusions.
PowerQuery: The PowerQuery, including columns (the query and the columns are in 2 separate fields in the database).
Threat Coverage: shows the OS covered by the threat hunting analytic, vulnerabilities covered, associated threat actors and associated threats.
MITRE Information: MITRE coverage (tactics, techniques and sub-techniques).
Emulation & Validation: Shows steps to emulate a behavior that will trigger the analytic. It uses the markdown syntax.
References: a list of links to learn more about the threat hunting analytic.
Search form
Search for a string in the threat hunting analytics names, descriptions and threat hunting notes.
Selected filters
List of applied filters. Click on the cross sign to remove a specific filter.
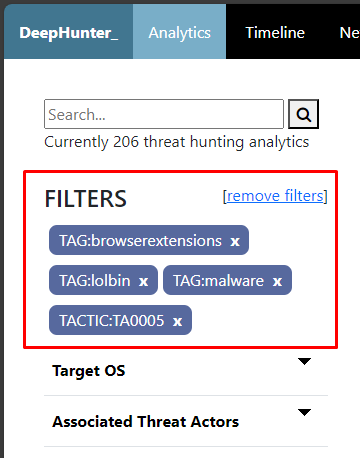
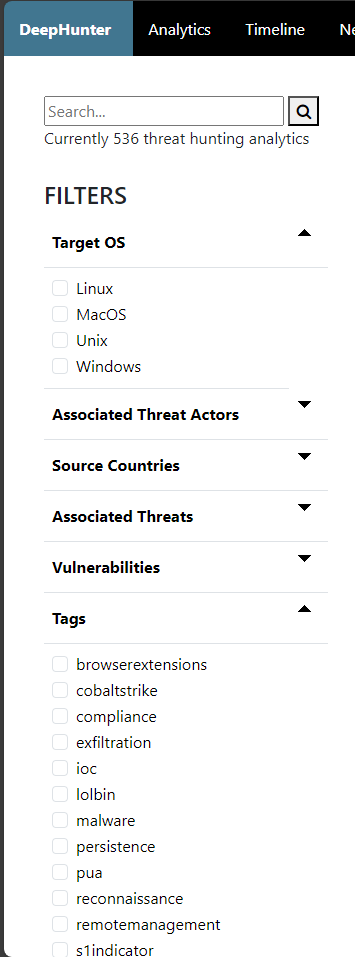
Available filters
The list of all possible filters, broken down into sections. Expand a section and select a filter. It will be immediately added to the list of selected filters and the page will refresh. You can add as many filters as you want. Filters from the same section are applied as a list of values (for example, if you select “Windows” and “Linux” as “Target OS”, it will show the list of threat hunting analytics that cover “Windows” or “Linux”).
Create/Modify/Clone analytics
Refer to this page.
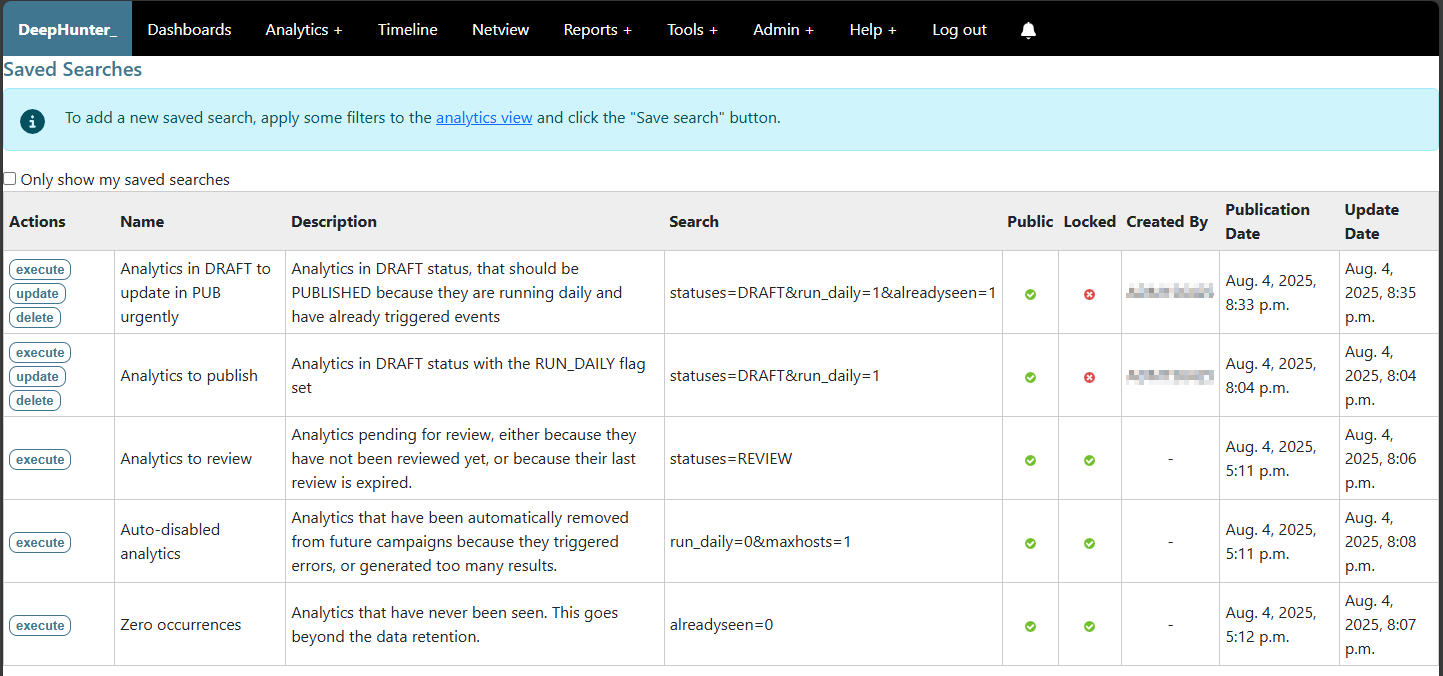
Saved Searches
Saved searches are a way to save a search query and its filters, so you can quickly access it later. This is useful if you often search for the same criteria.
There are public saved searches and private saved searches. Public saved searches are available to all users, while private saved searches are only available to the user who created them.
You can also lock a search (useful for public saved searches) so that no one can modify or delete it.
The checkbox acts as a toggle to switch between all saved searches or only saved searches created by the logged in user. By default, all saved searches are shown.
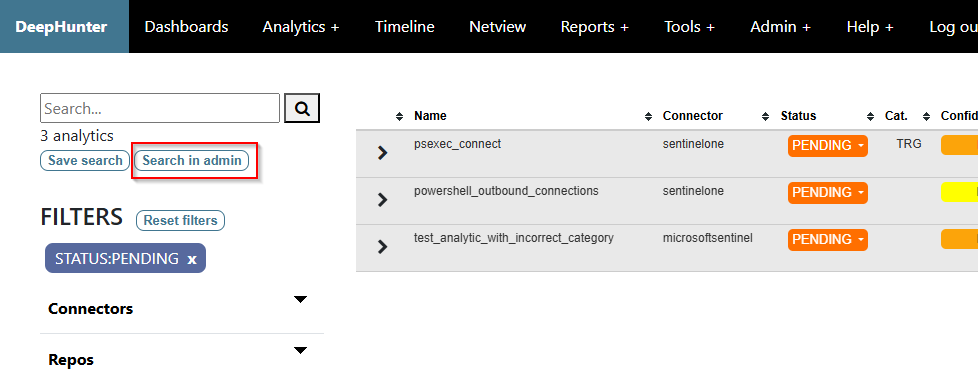
Bulk actions
It is possible to perform bulk actions on multiple threat hunting analytics at once. To do this, do a search and click the Search in admin button. It will send the search to the admin panel where you will be able to do bulk actions, including deleting analytics, and updating the status.